Showing posts with label price action trading. Show all posts

Morning Doji Star Pattern: The Ultimate Bullish Reversal Strategy Guide


Morning Doji Star Pattern: The Ultimate Bullish Reversal Strategy Guide

In the complex landscape of technical analysis, certain formations stand apart for their exceptional predictive power. The Morning Doji Star candlestick pattern represents one of the most reliable technical indicators available to traders, serving as a powerful beacon during extended bearish periods. This distinctive three-candle formation captures the precise moment when relentless selling pressure finally exhausts itself, giving way to a new bullish dawn that alert traders can capitalize upon for substantial gains.

The pattern's elegant structure unfolds with compelling logical progression. The initial candle emerges as a pronounced bearish bar, extending the established downward trajectory and reflecting pervasive market pessimism. The second session—the pattern's critical "star" component—reveals the first significant cracks in the bearish foundation. This candle typically gaps below the prior close yet manifests as a perfect Doji, where opening and closing prices converge almost exactly. This precise equilibrium signals that despite initial weakness, sellers have completely lost their momentum while buyers have achieved sufficient strength to prevent further decline.

The concluding candle delivers the decisive confirmation. A robust bullish bar gaps upward from the Doji and drives prices significantly higher, ultimately reclaiming a substantial portion of the territory lost during the initial sell-off. This powerful advance confirms that the preceding stalemate has been definitively broken in the bulls' favor, establishing a new positive sentiment paradigm.

Several crucial factors distinguish high-probability Morning Doji Star formations from ordinary price action. The pattern carries greatest significance when concluding an extended decline rather than appearing during neutral or consolidating market conditions. The Doji's positioning proves critical—it should appear clearly separated from the first candle's body, emphasizing the sentiment shift. The magnitude of the final bullish candle similarly impacts reliability, with larger bodies that recover significant ground indicating stronger conviction.

Trading this pattern successfully demands disciplined execution. While novice traders might anticipate the reversal upon spotting the Doji, experienced market participants patiently await the third candle's completion. Entry strategies range from positioning at the pattern's close to implementing buy-stops above the formation's high, ensuring continued momentum before committing capital. Protective stop-loss orders logically reside beneath the pattern's lowest point, typically below the Doji's low, invalidating the bullish thesis if breached.

Profit objectives generally align with preceding resistance zones or maintain favorable risk-reward parameters, often targeting returns representing 1.5 to 2 times the initial risk. For extended advances, traders might employ trailing stops to capture sustained upward moves while protecting accumulated gains.

The psychological narrative underlying this pattern explains its enduring relevance among technical analysts. The initial sell-off represents capitulation—the final surrender of weak holders. The Doji illustrates the market's transformational moment, where neither bulls nor bears can claim dominance. The conclusive bullish candle demonstrates decisive victory for buyers, often fueled by new information or reassessed valuations that attract substantial capital.

While remarkably prescient, the Morning Doji Star pattern doesn't guarantee success. False signals occasionally occur, particularly during powerful bear markets where temporary rallies quickly succumb to renewed selling pressure. This reality underscores why prudent position sizing and strict risk management remain indispensable components of professional implementation.

Mastering this sophisticated reversal pattern provides traders with a structured methodology for identifying potential trend transitions. By combining pattern recognition with contextual analysis and disciplined trade management, market participants can consistently identify high-probability reversal opportunities. The Morning Doji Star pattern endures as a technical analysis cornerstone precisely because it so elegantly captures the market's critical transition from despair to opportunity, offering prepared traders a systematic approach to capitalizing on emerging trends at their earliest stages.

Bullish Engulfing Pattern: The Ultimate Guide to Trading This Powerful Reversal Signal


Bullish Engulfing Pattern: The Ultimate Guide to Trading This Powerful Reversal Signal

In the constant struggle between market pessimism and optimism, certain formations signal dramatic power shifts. The Bullish Engulfing candlestick pattern represents one of technical analysis' most respected reversal indicators, capturing the precise moment when buyer conviction overwhelms established selling pressure. This two-candle formation doesn't merely suggest a pause in downward momentum—it reveals a fundamental transformation in market sentiment that can launch powerful new advances.

The pattern's visual structure tells a compelling story. During a defined downtrend, a bearish candle emerges, reinforcing the prevailing negative sentiment. The following session opens with continued weakness, typically gapping below the prior close. Yet instead of extending losses, the dynamic abruptly reverses. Buyers swarm in, driving prices upward throughout the session until closing decisively above the previous day's opening level. The resulting green candle completely envelops the red candle's body, visually demonstrating how optimism has consumed the prior period's pessimism.

What separates meaningful engulfing patterns from insignificant price action? Several factors determine its potential effectiveness. The size disparity between candles proves crucial—a substantial engulfing body indicates stronger conviction than a minimal overlap. Context remains paramount; the pattern carries greatest significance when terminating a clear downtrend rather than forming within random consolidation. Volume provides critical confirmation, with elevated activity during the bullish candle validating genuine institutional participation rather than temporary noise.

Trading this pattern successfully demands disciplined execution beyond simple recognition. While novice traders might jump in at the pattern's completion, experienced market participants implement strategic entries. Some position entries at the engulfing candle's close, while others await additional confirmation through subsequent price action, perhaps entering as the next candle surpasses the pattern's high. This patient approach filters false signals despite potentially missing the absolute lowest entry.

Risk management separates profitable pattern traders from hopeful gamblers. Protective stop-loss orders logically belong beneath the engulfing pattern's low, representing the level where the bullish thesis becomes invalid. Profit targets typically align with nearby resistance zones or maintain favorable risk-reward ratios, often seeking gains representing 1.5 to 2 times the initial risk. For extended trends, traders might employ trailing stops to capture maximum upside while protecting accumulated profits.

The psychological narrative underlying this pattern explains its enduring relevance. The initial red candle represents fading hope as sellers dominate trading activity. The engulfing candle's open exploits this pessimism, catching remaining sellers by surprise before vigorous buying pressure overwhelms all resistance. This dramatic reversal frequently traps late short-sellers while encouraging sidelined investors to participate, creating the momentum necessary to establish new uptrends.

While remarkably reliable, the Bullish Engulfing pattern doesn't guarantee success. False signals occasionally emerge, particularly during pronounced bear markets where temporary bounces quickly succumb to renewed selling pressure. This reality underscores why confirmation and strategic stop-loss placement remain non-negotiable components of professional implementation.

Mastering this powerful formation provides traders with a structured methodology for identifying potential trend reversals. By combining pattern recognition with contextual analysis, volume confirmation, and disciplined risk management, market participants can consistently identify high-probability opportunities. The Bullish Engulfing pattern remains a cornerstone of technical analysis precisely because it so vividly captures the market's eternal cycle between fear and opportunity, offering prepared traders a strategic advantage in timing their entries.

Bullish Pin Bar Mastery: The Definitive Guide to Profitable Reversal Trading


Bullish Pin Bar Mastery: The Definitive Guide to Profitable Reversal Trading


In the complex landscape of financial markets, certain signals stand out for their clarity and predictive power. The Bullish Pin Bar candlestick pattern is one such formation, revered by price action traders for its ability to signal potential trend reversals with remarkable accuracy. This distinctive pattern serves as a visual narrative of a battle between bulls and bears, where the bulls ultimately emerge victorious, rejecting lower prices and setting the stage for an upward move.

Understanding the anatomy of a Bullish Pin Bar is fundamental. The pattern is instantly recognizable by its long lower wick, which should be at least two to three times the length of its small real body. This body sits at the top of the candle's range, with a minimal or nonexistent upper wick. The color of the body is secondary; whether it closes green or red, the story remains the same. The long lower wick, often called the "tail" or "nose," represents a period where sellers attempted to drive prices down. However, their dominance was short-lived. Aggressive buying pressure forced the price to rebound, closing the session near its open, thus forming the small body at the top. This price action creates a clear fingerprint of rejection at the lows.

However, spotting the pattern is only the first step. The true skill lies in identifying high-probability setups. A Bullish Pin Bar found in the middle of a ranging market holds little significance. Its power is unleashed when it forms at a critical juncture. Specifically, you must look for this pattern during a established downtrend and, ideally, at a predefined level of support. This support could be a previous swing low, a significant psychological price level, a rising trendline, or a key moving average like the 50 or 200-day EMA. This confluence of the pattern and a strategic support level dramatically increases the odds of a successful reversal.

Executing a trade based on this signal requires a disciplined, three-step process. First, always wait for confirmation. The safest entry is a buy order placed above the high of the Pin Bar candle itself, signaling that the bullish momentum has continued into the next session. Second, ironclad risk management is non-negotiable. Your stop-loss must be placed prudently below the very bottom of the Pin Bar's long tail. This level marks the point of rejection, and if the price breaks below it, the signal is void. Finally, for taking profits, consider a risk-to-reward ratio of at least 1:2 or target the next significant resistance level.

Like any tool, the Bullish Pin Bar has its limitations. It is crucial to avoid the pitfall of ignoring volume; a pattern with high trading volume offers a much stronger confirmation. Furthermore, never chase a trade if you miss the ideal entry point. The market always provides new opportunities. By integrating the Bullish Pin Bar into a broader trading plan that emphasizes context and discipline, you equip yourself with a powerful edge for capturing lucrative reversal moves in any market.

Master the Marubozu Candlestick: The Ultimate Guide to Trading Bald Momentum


Master the Marubozu Candlestick: The Ultimate Guide to Trading Bald Momentum

In the vibrant tapestry of technical analysis, certain patterns cut through the market noise with sheer, undeniable force. The Marubozu candlestick is one such formation, a powerful symbol of conviction that every chartist should master. Its very name, derived from the Japanese for "bald head," reveals its core characteristic: a commanding candle with little to no wicks. This unique appearance is your direct insight into a market where one side has achieved total dominance.

Understanding the two primary types of Marubozu is crucial for interpreting market sentiment. The Bullish Marubozu emerges as a long, green body that opens at its low and closes at its high. This structure tells a compelling story of unwavering buying pressure. From the opening bell, bulls seize control, driving the price relentlessly upward without significant pullbacks. The absence of wicks confirms that sellers were powerless throughout the session, making it a potent signal of continued upward momentum, especially when found after a dip or at a support level.

Conversely, the Bearish Marubozu is a stark red candle that opens at its high and closes at its low. It paints a picture of overwhelming pessimism and selling pressure. Bears command the session from the start, forcing prices down with no meaningful recovery. The lack of upper and lower shadows indicates that buyers were completely absent, unable to mount any counter-attack. Spotting this pattern during an uptrend or at a resistance zone can serve as a critical warning of an impending downturn.

To effectively trade these patterns, context is your greatest ally. A Marubozu is not a solitary signal but a powerful piece of the puzzle. The most profitable applications often come from breakouts. A Bullish Marubozu blasting through a key resistance level on high volume signals a genuine, strong-legged breakout. Similarly, a Bearish Marubozu slicing through support suggests a breakdown is likely to continue.

For optimal results, always seek confirmation. While the Marubozu itself is a powerhouse, its signal is fortified by the subsequent candle closing in the same direction. Furthermore, aligning these patterns with other technical tools, such as a rising Relative Strength Index (RSI) from oversold territory for a bullish signal, or high trading volume, drastically increases the probability of a successful trade.

In conclusion, the Marubozu candlestick is more than just a pattern; it is a clear declaration of market intent. By learning to identify its "bald" structure and interpreting its message within the broader trend, you equip yourself to ride waves of strong momentum. Integrate this knowledge with sound risk management, using the extremes of the Marubozu as logical points for your stop-loss orders, and you unlock a valuable edge in your trading journey.

Gravestone Doji Candlestick Pattern: How to Spot & Trade Bearish Reversals Like a Pro


Gravestone Doji Candlestick Pattern: How to Spot & Trade Bearish Reversals Like a Pro

The Gravestone Doji isn’t just another candlestick—it’s a silent alarm bell ringing at market tops. Shaped like an inverted T, this single-candle pattern forms when an asset opens, surges higher during the session, but then collapses back to its opening price by the close, leaving behind a long upper wick and virtually no body. The absence of a lower shadow makes it visually distinct and psychologically significant.

What makes the Gravestone Doji so compelling is the story it tells: bulls tried to push prices up, but failed spectacularly. Early optimism gave way to aggressive selling, often triggered by resistance levels, profit-taking, or negative sentiment. The longer the upper shadow, the stronger the rejection of higher prices—making this pattern a high-conviction warning sign when it appears after a sustained uptrend.

However, like all candlestick signals, context is king. A Gravestone Doji emerging near a multi-week high, especially alongside overbought RSI readings or at a key Fibonacci extension level, carries far more weight than one forming in a choppy, directionless market. Its true power lies in its role as a top-reversal indicator—not a bottom signal or a continuation pattern.

Crucially, never act on this pattern alone. The market loves to trap impulsive traders. Always wait for confirmation: a follow-up candle that closes below the Gravestone Doji’s open (or low) dramatically increases the odds of a successful short trade. Add volume analysis—spiking volume on the Doji day or the confirmation candle suggests institutional participation and adds legitimacy to the move.

Smart traders also layer in confluence: Is price hitting a prior resistance zone? Is the 50-day moving average acting as dynamic resistance? Is MACD rolling over from overbought territory? When multiple technical factors align with the Gravestone Doji, the setup becomes exponentially more reliable.

For execution, place a stop-loss just above the candle’s high to protect against false breakdowns. Target the nearest support level or use a measured move based on the prior swing. Risk-reward ratios of at least 1:2 should be the standard.

Real-world examples abound. In 2021, Bitcoin formed a textbook Gravestone Doji near $69,000—its all-time high—before crashing over 40% in weeks. Similarly, major stocks like Tesla and Meta have flashed this pattern ahead of sharp corrections during euphoric rallies.

Avoid common pitfalls: don’t use it on ultra-short timeframes where noise dominates, and never ignore broader market conditions. A Gravestone Doji during a Fed rate hike announcement carries different weight than one in calm summer trading.

In essence, the Gravestone Doji is a masterclass in market psychology—capturing the moment optimism peaks and reality sets in. For traders who respect its warning, it’s not just a pattern; it’s a strategic edge. Master it, confirm it, and let it guide your exits before the crowd realizes the trend has turned.

Master Doji Candlesticks: Spot Market Reversals with Dragonfly & Gravestone Patterns


Master Doji Candlesticks: Spot Market Reversals with Dragonfly & Gravestone Patterns

In the noisy arena of financial markets, where bulls and bears constantly clash, moments of pure silence often speak loudest. The Doji candlestick represents precisely such a moment - a perfect stalemate where prices open and close at virtually identical levels, creating a cross-like pattern on your chart. This seemingly simple formation carries profound implications, serving as a powerful warning that the current trend may be losing steam and a reversal could be imminent.

Understanding the Doji requires looking beyond its basic definition. The pattern's true significance lies in its context and subsequent confirmation. A Doji appearing after a sustained uptrend signals that buying pressure is waning, while one forming after a prolonged downtrend suggests selling momentum is fading. However, the critical rule every trader must remember: never trade the Doji alone. This pattern indicates indecision, not direction. The confirmation candle that follows provides the real trading signal, proving which side ultimately wins the battle.

Among the Doji family, four distinct personalities emerge, each telling a unique story about market psychology. The Common Doji, with its balanced upper and lower shadows, represents pure equilibrium - neither bulls nor bears could gain ground. The Long-Legged Doji tells a more dramatic tale, with extended shadows revealing a session of intense volatility where prices swung wildly in both directions yet settled exactly where they began.

The most revealing Doji variations are the Dragonfly and Gravestone patterns. The Dragonfly Doji forms when prices open and close at the session's high, creating a T-shaped pattern with a long lower shadow. This indicates sellers initially dominated, pushing prices sharply lower, only to encounter aggressive buying that completely reversed the decline. When this appears during a downtrend, it strongly suggests bearish exhaustion and potential upward reversal.

Conversely, the Gravestone Doji presents the exact opposite scenario. With its long upper shadow and opening/closing prices at the session's low, this inverted T-shape reveals that bulls initially rallied prices higher, only to face overwhelming selling pressure that erased all gains. Appearing at market tops, this pattern often foreshadows significant downward moves.

Successful Doji trading follows a disciplined process. First, identify the prevailing trend. Second, spot the Doji formation at potential exhaustion points. Third, classify which type of Doji has appeared. Fourth, and most importantly, wait for confirmation - a bullish candle closing above the Doji's high for potential buy signals, or a bearish candle closing below its low for sell signals. Finally, always implement proper risk management with stop-loss orders placed beyond the Doji's extreme points.

Mastering these subtle yet powerful patterns transforms how you read price action. Rather than merely reacting to momentum, you learn to anticipate potential turning points by recognizing when markets reach equilibrium. The Doji doesn't guarantee a reversal, but it brilliantly signals when conditions are ripe for one, giving alert traders a significant edge in navigating market transitions.

Candlestick Colors Explained: How to Instantly Read Market Sentiment


Candlestick Colors Explained: How to Instantly Read Market Sentiment

Candlestick Colors Explained: How to Instantly Read Market Sentiment

In the fast-paced world of trading, speed and clarity are everything. While complex indicators have their place, some of the most powerful information is delivered through a simple, universal code: the color of a candlestick. Understanding the meaning behind green, red, white, and black candles is not just a beginner's lesson—it's a fundamental skill that allows you to gauge market psychology at a single glance.

Every candlestick tells a story of a battle between buyers (bulls) and sellers (bears) over a specific period. The candle's color reveals the final score of that battle. In the modern digital age, we primarily use an intuitive color scheme. A green candlestick is a clear signal of bullish victory. It forms when the closing price is higher than the opening price, indicating that buyers were in control and pushed the asset's value up. This color, associated with growth and go, instantly communicates optimism and buying pressure.

Conversely, a red candlestick signals a win for the sellers. It appears when the session closes lower than it opened, visually representing downward momentum and selling pressure. The color red, synonymous with stop and warning, immediately conveys a sense of caution and market pessimism. The intensity of the move is often reflected in the body's size; a long, deep red candle suggests intense selling, while a short one may indicate indecision.

Beyond the modern scheme lies the traditional one, originating from 18th-century Japan. Here, white (or hollow) candles serve the exact same purpose as green ones, marking a session where the price climbed. Black (or filled) candles are the direct counterparts to red, indicating a close below the open. Many seasoned traders prefer this classic aesthetic for its clean visual contrast. The key takeaway is universal: a light color (green/white) means the price rose; a dark color (red/black) means it fell.

However, the story doesn't end with the color of the body. The shadows, or wicks, add crucial depth. A long upper shadow on a red candle shows that buyers attempted a rally during the session, but sellers forcefully beat them back. A long lower shadow on a green candle reveals that sellers staged a sell-off, but buyers aggressively stepped in to "buy the dip," leading to a strong recovery.

Mastering this visual language transforms how you see a chart. You stop seeing random colored bars and start reading a narrative of conflict, fear, and greed. By instantly interpreting candlestick colors and their shapes, you can quickly identify the dominant trend, spot potential exhaustion in a move, and make more informed, confident trading decisions. It is the essential first step in transitioning from a passive observer to an active, strategic participant in the markets.

Bullish vs Bearish Candlesticks: Master the Language of the Markets


Bullish vs Bearish Candlesticks: Master the Language of the Markets


Bullish vs Bearish Candlesticks: Master the Language of the Markets

To the untrained eye, a stock chart is a chaotic mess of lines and colored bars. But for those who understand its language, each element tells a clear story of conflict, fear, and greed. The most fundamental words in this language are Bullish and Bearish candlesticks. Mastering their meaning is the first step to becoming fluent in the market's narrative.

Think of every trading period—whether a minute or a month—as a self-contained battle. The opening price is the starting line, and the closing price is the final score. A Bullish Candlestick is born when this battle ends with the buyers, or "bulls," in victory. This means the price closed higher than it opened. Visually, this is represented by a green or white "body." The critical takeaway is optimism; it signifies that throughout the session, demand overcame supply, pushing the asset's value upward. The longer the body, the more decisive the bulls' victory was.

Conversely, a Bearish Candlestick signals a win for the sellers, the "bears." It forms when the closing price falls below the opening price, leaving a red or black body on the chart. This reflects a period dominated by pessimism and selling pressure. It tells you that supply outstripped demand, driving the price down. A long, red body indicates intense selling conviction.

However, the story isn't complete with just the body. The shadows, or wicks, add crucial depth to the plot. A long lower shadow on a bullish candle reveals that while the bulls won the day, the bears briefly staged a strong offensive, driving prices down before being soundly rejected. This is a powerful sign of underlying strength and potential support. Similarly, a long upper shadow on a bearish candle shows a failed rally—a moment of buyer hope that was crushed by overwhelming selling pressure, indicating a formidable resistance level.

True trading wisdom comes from interpreting these candles in context, not in isolation. A single green candle in a steep downtrend is merely a pause, not a prophecy. The real power emerges in specific sequences known as patterns. A Bullish Engulfing Pattern, where a large green candle completely swallows a prior small red one, screams of a potential trend reversal from down to up. Its opposite, the Bearish Engulfing Pattern, warns that an uptrend may be exhausting itself as sellers seize control.

Ultimately, learning to distinguish bullish from bearish candlesticks is about more than just recognizing colors. It's about gauging market psychology in real-time. By identifying who controls the market—the optimistic bulls or the pessimistic bears—you shift from reacting to past price movements to anticipating future ones. This foundational knowledge empowers you to identify high-probability entry and exit points, transforming random speculation into strategic, informed decision-making. Start observing these candles on your charts; you'll be amazed at the stories they begin to tell.


Master Candlestick Structure: Decoding Open, High, Low & Close for Smarter Trading


Master Candlestick Structure: Decoding Open, High, Low & Close for Smarter Trading


Master Candlestick Structure: Decoding Open, High, Low & Close for Smarter Trading

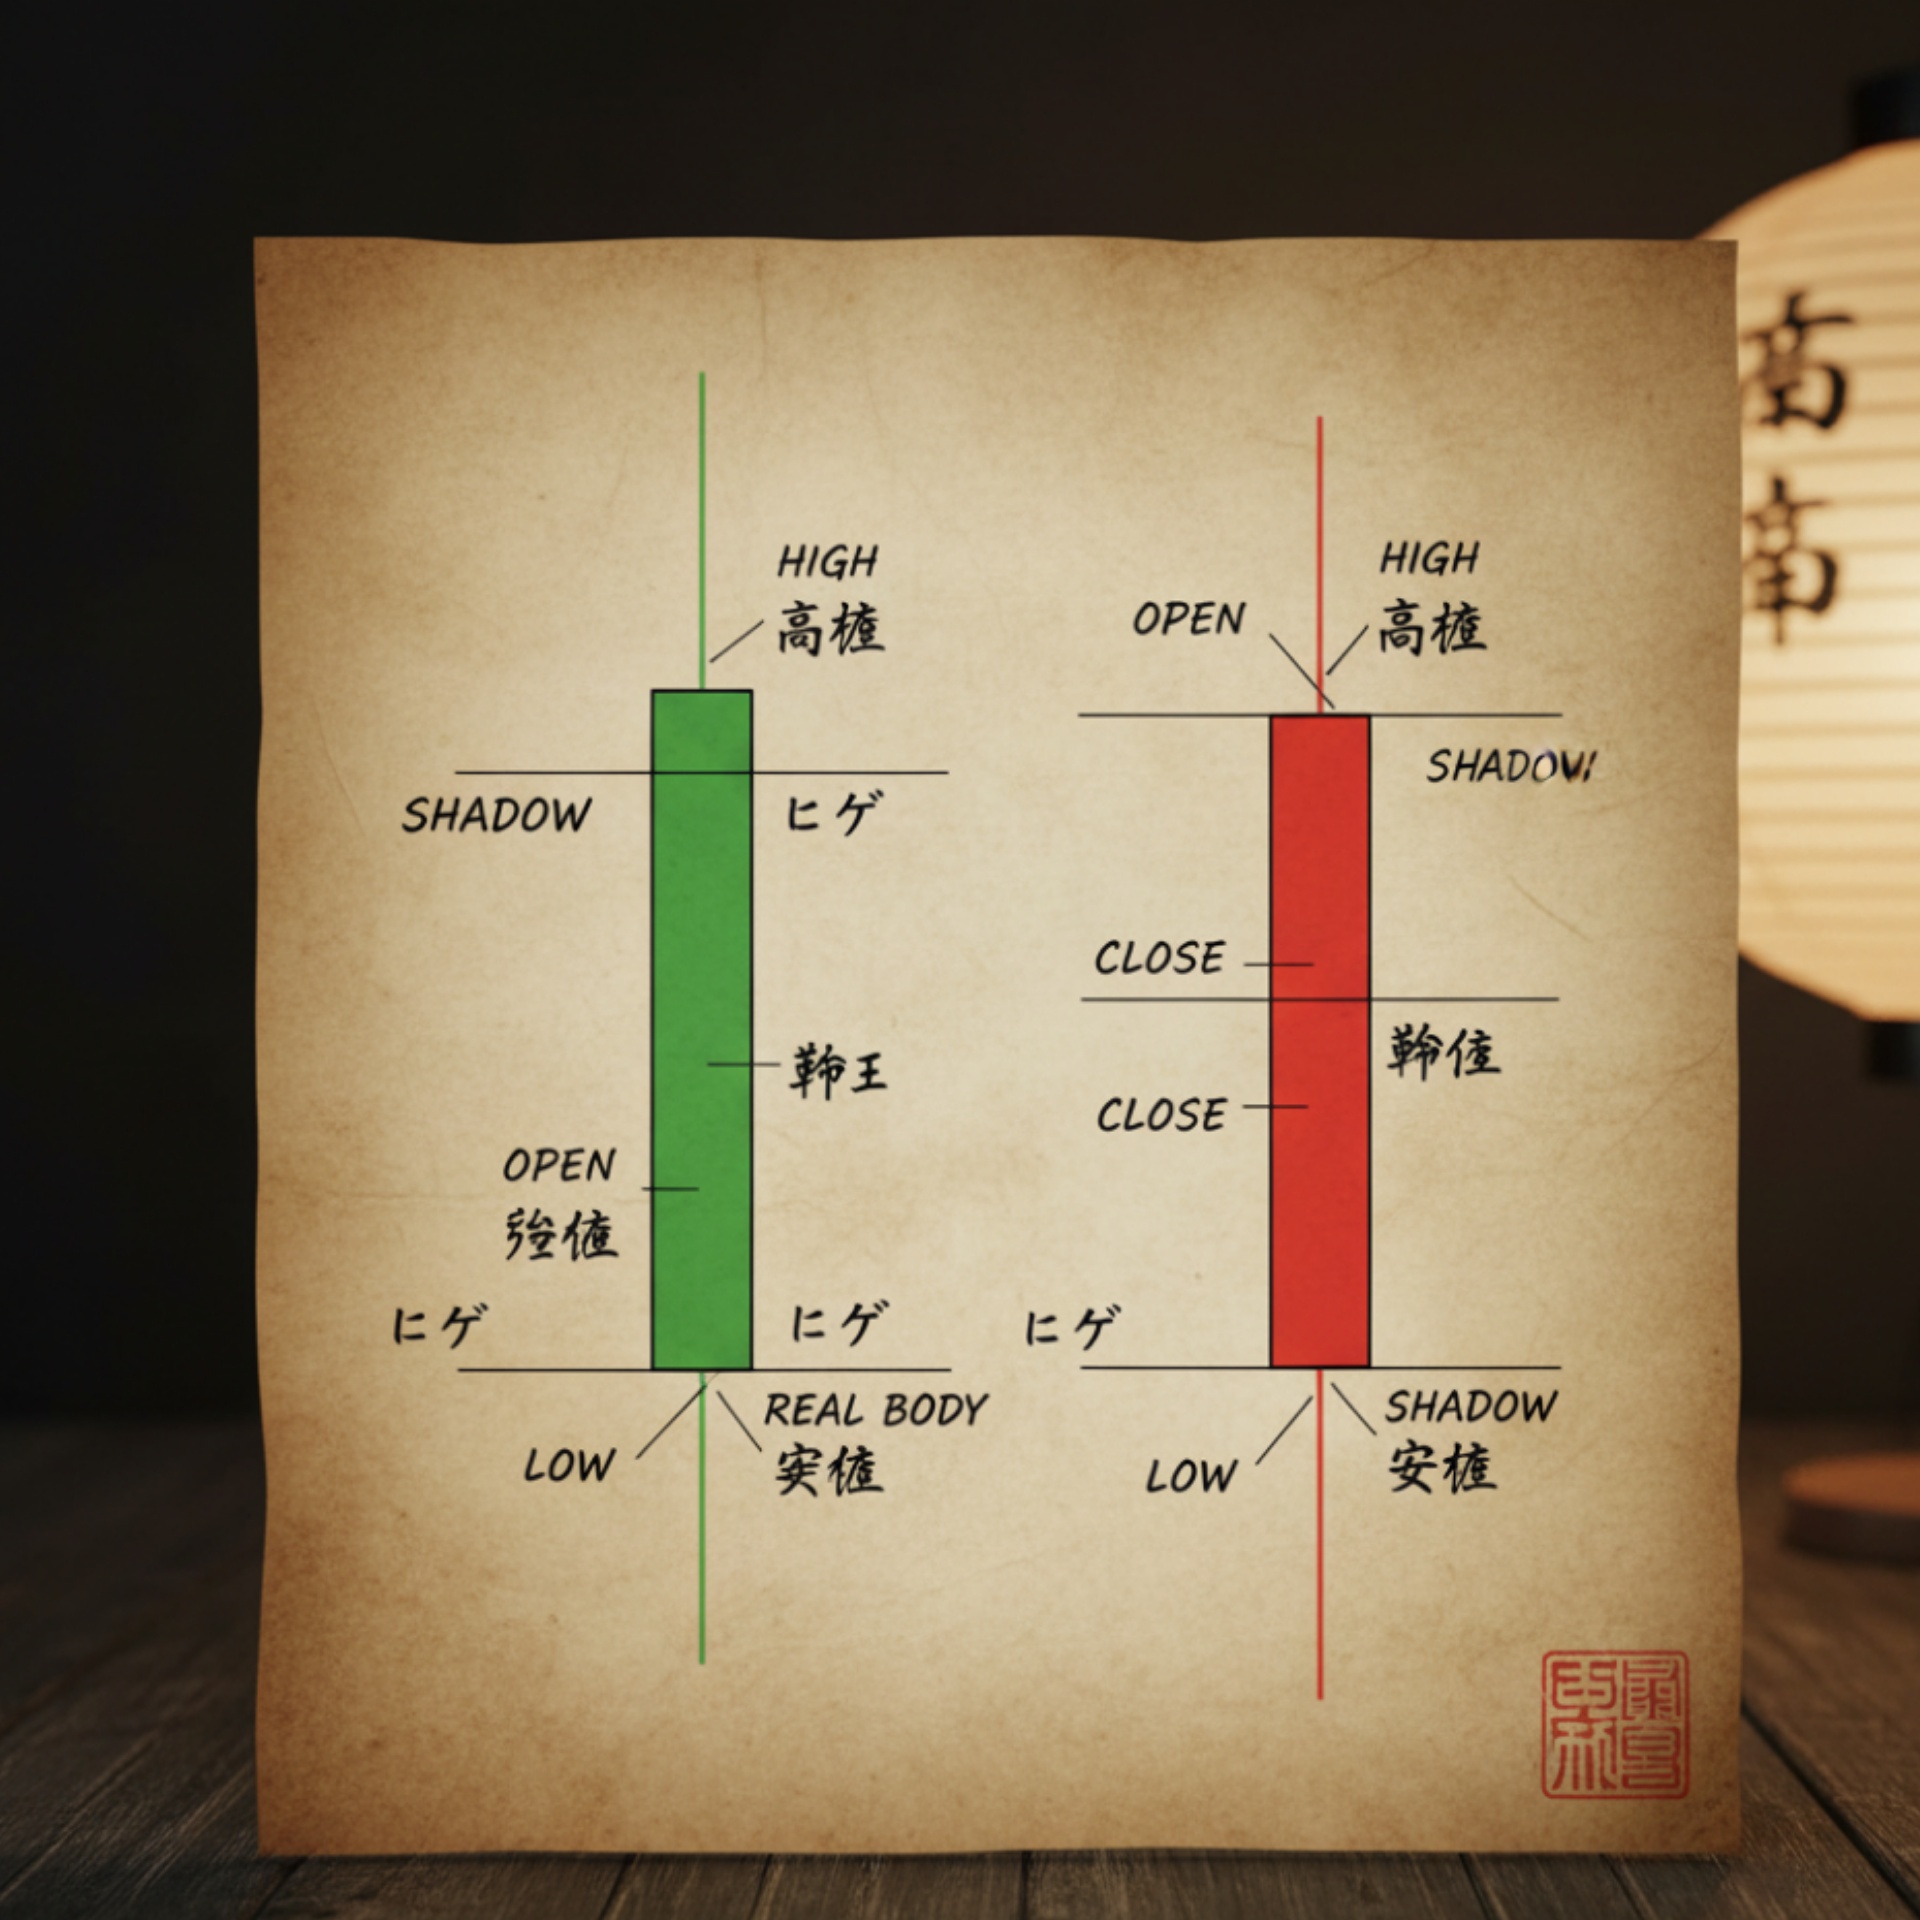
In the dynamic world of financial markets, candlestick charts serve as a trader’s visual compass—translating complex price movements into clear, actionable insights. At the core of every candlestick lie four essential data points: Open, High, Low, and Close (OHLC). Far more than mere numbers, these values capture the emotional pulse of the market within a specific timeframe—whether it’s one minute, one hour, or one week.


The Openmarks where trading began during the period, setting the initial tone. The Close, often deemed the most significant of the four, reveals where consensus settled by period’s end. When the Close sits above the Open, a bullish (typically green) candle forms—signaling buyer dominance. Conversely, a Close below the Open creates a bearish (usually red) candle, highlighting seller control.


Flanking the central body are the wicks—thin lines that map the session’s extremes. The top wick stretches to the High, showing where upward momentum met resistance. The bottom wick drops to the Low, indicating where selling pressure was absorbed by buyers. Long wicks often hint at rejection: a long upper wick suggests failed bullish attempts, while a long lower wick may signal strong support.

What makes candlesticks uniquely powerful is their ability to convey story and sentiment in a single glance. A small-bodied candle with long wicks—like a doji—reflects indecision, while a bold green candle with minimal wicks shows confident buying. Traders use these visual cues not in isolation, but within broader contexts: trend direction, volume, and key support/resistance levels.

Understanding OHLC isn’t just about reading charts—it’s about interpreting market psychology. For instance, a stock opening at $50, spiking to $55, dipping to $48, then closing at $54 tells a tale of early volatility followed by strong recovery. This narrative helps traders anticipate breakouts, reversals, or consolidation phases.

Modern platforms like TradingView, MetaTrader, and even free tools on Yahoo Finance render candlesticks in real time, making OHLC analysis accessible to everyone—from beginners to pros. Yet, the true edge comes from consistent practice: journaling candle behavior, backtesting patterns, and aligning candle signals with risk management rules.

Whether you're day trading crypto, swing trading stocks, or analyzing forex pairs, mastering candlestick structure gives you a foundational skill that transcends markets and timeframes. It’s not about predicting the future—it’s about reading the present with clarity.

In today’s fast-paced trading environment, where milliseconds matter and algorithms dominate, the humble candlestick remains a timeless tool. By learning to decode its open, high, low, and close, you equip yourself with a visual language that speaks volumes—without a single word. Start with one candle, then connect the dots. Your trading journey will never look the same.